

XAU/USD Slump Extends Ahead of Fed Rate Decision
[ad_1]
GOLD OUTLOOK
- Fed forecasts hurt gold prospects.
- Dampened inflation expectations.
- Mixed IG Client Sentiment.
XAU/USD FUNDAMENTAL BACKDROP
Yesterday’s lower liquidity via bank holidays throughout many global nations did not leave gold unscathed with markets adding to a fading gold price. Spot gold pierced below support targets last seen in mid-February 2022 and looks to test subsequent levels as fundamentals look to align with bullion bears.
5-year inflation forecasts shown in the graphic below show a significant decline thus lessening gold’s attractiveness as an inflation hedge. Relatively subdued crude oil prices are adding to the reduced forecasts – crude oil often acts as a barometer for inflationary pressure (positive relationship).
U.S. DOLLAR 5Y5Y INFLATION LINKED SWAP
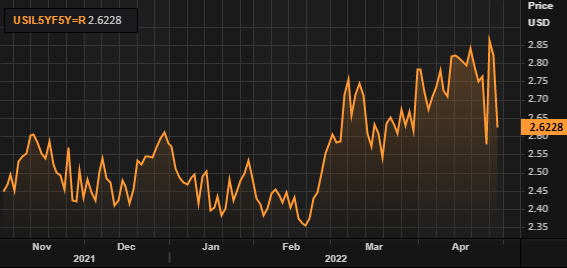
Source: Refinitiv
Perhaps the strongest headwind facing gold upside comes from the dollar, and with the upcoming Federal Reserve rate decision whereby money markets are currently pricing in a 50bps rate hike (coupled with the start of quantitative tightening) with the possibility of a 75bps hike in the June or July meet. Lower GDP figures have somewhat dampened this supper aggressive narrative but rising wages and a tight labor market leaves the option on the table. Upcoming economic data will dictate the Fed stance but for now I expect a 50bps with no chance of a 75bps surprise. The dollar remains favored with the U.S. economy being able to withstand such aggressive tightening regardless of external factors leaving gold exposed to a lengthy drop, while the situation in other major economies namely Europe and China are detracting investors leaving the dollar as the preferred choice.
ECONOMIC CALENDAR
As mentioned above, the highlight this week comes from tomorrow’s FOMC (see calendar below) meet with Friday’s NFP and unemployment stats closing off the trading week. The post-Fed press conference could hold important clues to the thought process of the Fed and could lead to significant price volatility, so I suggest sound risk management on open positions. DailyFX will be covering the event live as per normal and providing post-Fed analysis should you miss the event.
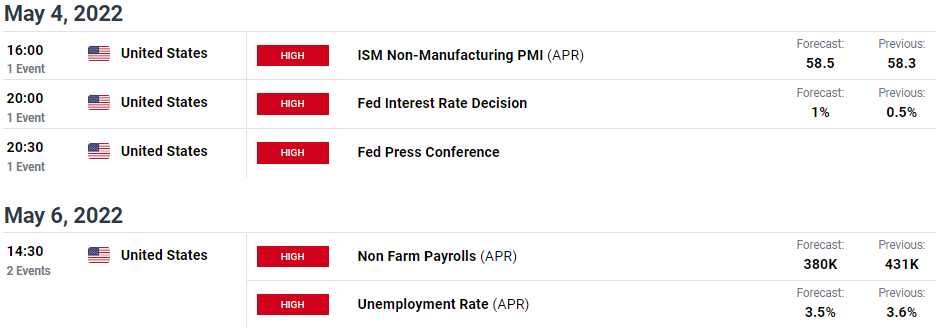
Source: DailyFX Economic Calendar
TECHNICAL ANALYSIS
GOLD PRICE DAILY CHART
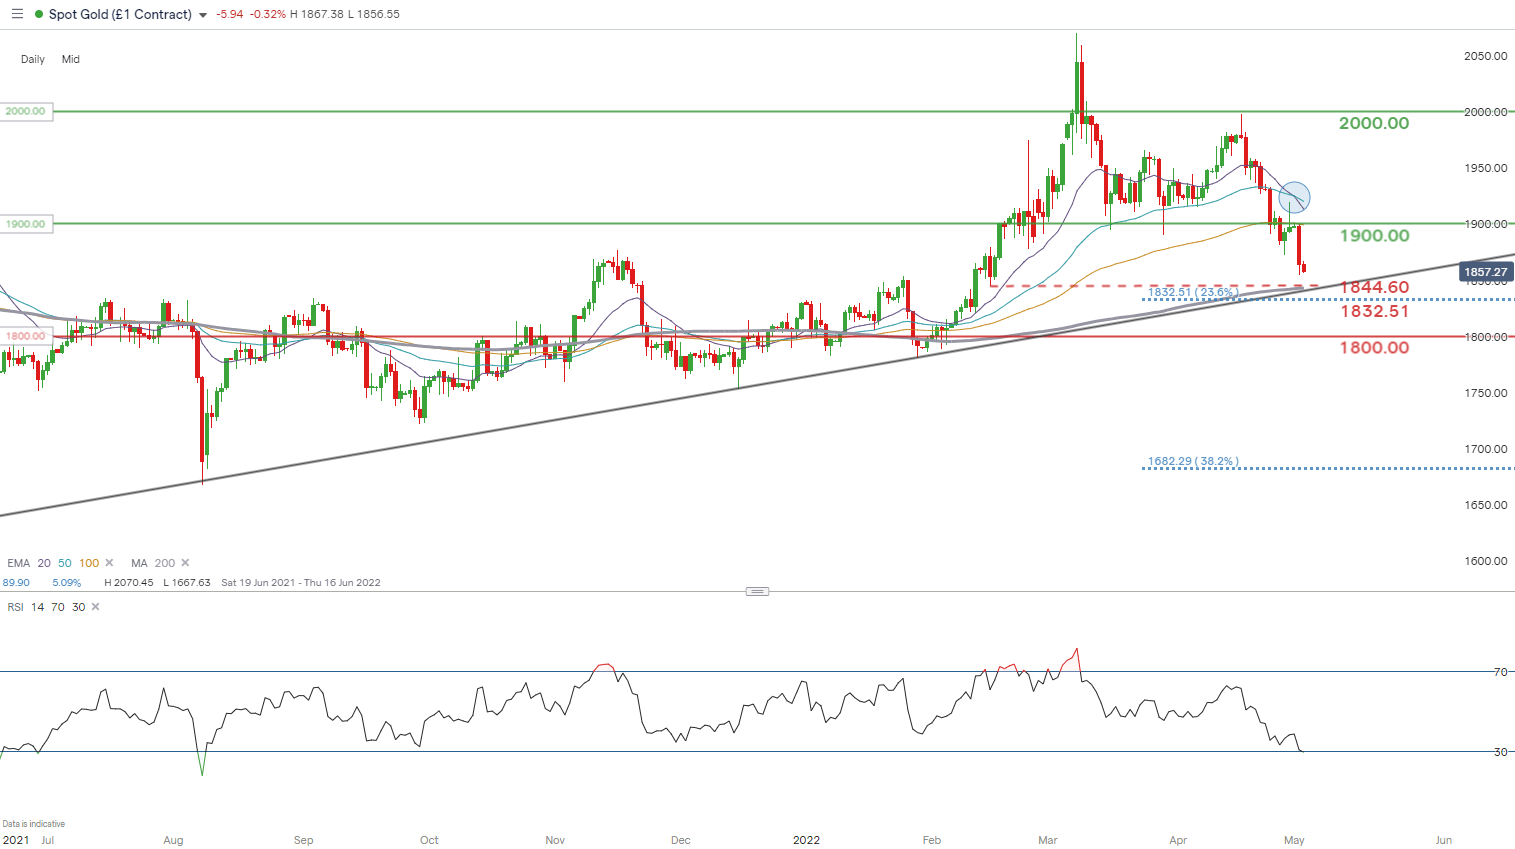
Chart prepared by Warren Venketas, IG
The daily spot gold chart above shows yesterday’s slide lower confirming the 1900.00 psychological level as resistance. The bearish EMA crossover (blue) traditionally points to ominous signs for traded asset and could lead to a test of the key area of confluence
around the medium-term trendline (black), 200-day SMA (grey) and the February swing low at 1844.60. I do believe this level will be tried by gold bears with the 1800.00 the focus in the medium-term. A confirmed candle break below the aforementioned support structures may open up room for the 1800.00 target and beyond.
Resistance levels:
- 1900.00
- 100-day EMA (yellow)
Support levels:
- 1844.60/200-day SMA/trendline support
- 1832.51 (23.6% Fibonacci)
- 1800.00
HESITANT IG CLIENT SENTIMENT
IGCS shows retail traders are currently distinctly LONG on gold, with 82% of traders currently holding long positions (as of this writing). At DailyFX we typically take a contrarian view to crowd sentiment however, due to recent changes in long and short positioning a mixed bias is preferred.
Contact and follow Warren on Twitter: @WVenketas
[ad_2]
Source link